BACK
Category Report (£499.99+VAT)
Published - At point of purchase
Want to know volume, value, average selling price and top 20 brand performance over the last 5 years for the sub-category of your choice?
We’ve got it all covered, from lights and helmets down to cables and socks, and everything in between.
£599.99
Market Data Category Reports
Step 1: Buy the category report
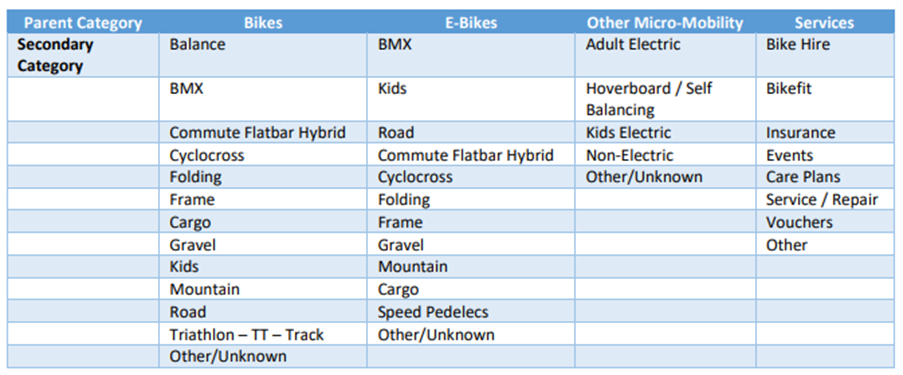
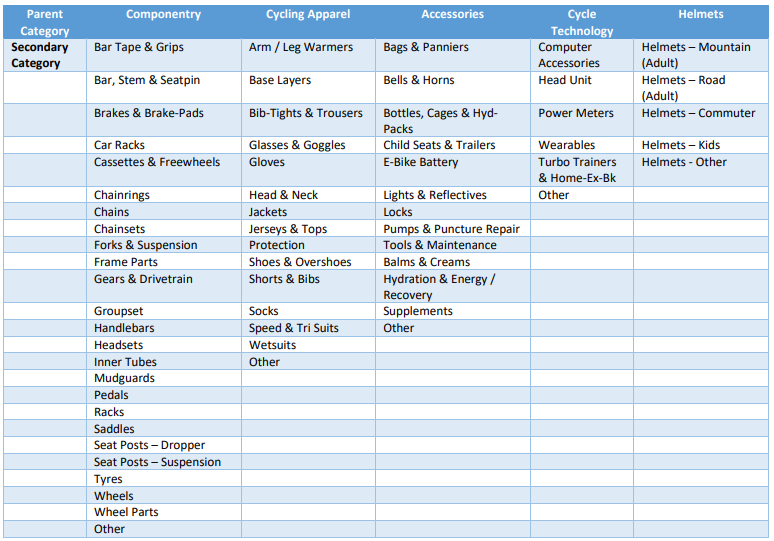
Step 2: We will email you confirming receipt of your purchase. At this point we will ask you to confirm your chosen category for your bespoke report. You can choose from the following options:
Step 3: We will prepare your report with the following detail and send to an email address of your choosing. Please allow up to 5 working days to receive your report.
- Total market by value, by year, from 2018
- Total market units / volume, by year, from 2018.
- Average market Average Selling Price by year from 2018.
- Total market value by channel (store, click and collect, online) by year from 2018.
- Total market units/ volume by channel, by year, from 2018.
- Total market value by top brands (8 in this category) by year from 2018.
- Top brand market share by year from 2018.
- Top brand ASP by year from 2018.
- Total market breakdown by segment (generalist or specialist retailer) by year from 2018.
- Seasonality analysis graph: value by month over last 5 years.
If you have any questions or if you need a VAT receipt please email us at [email protected]